
Figure 1.
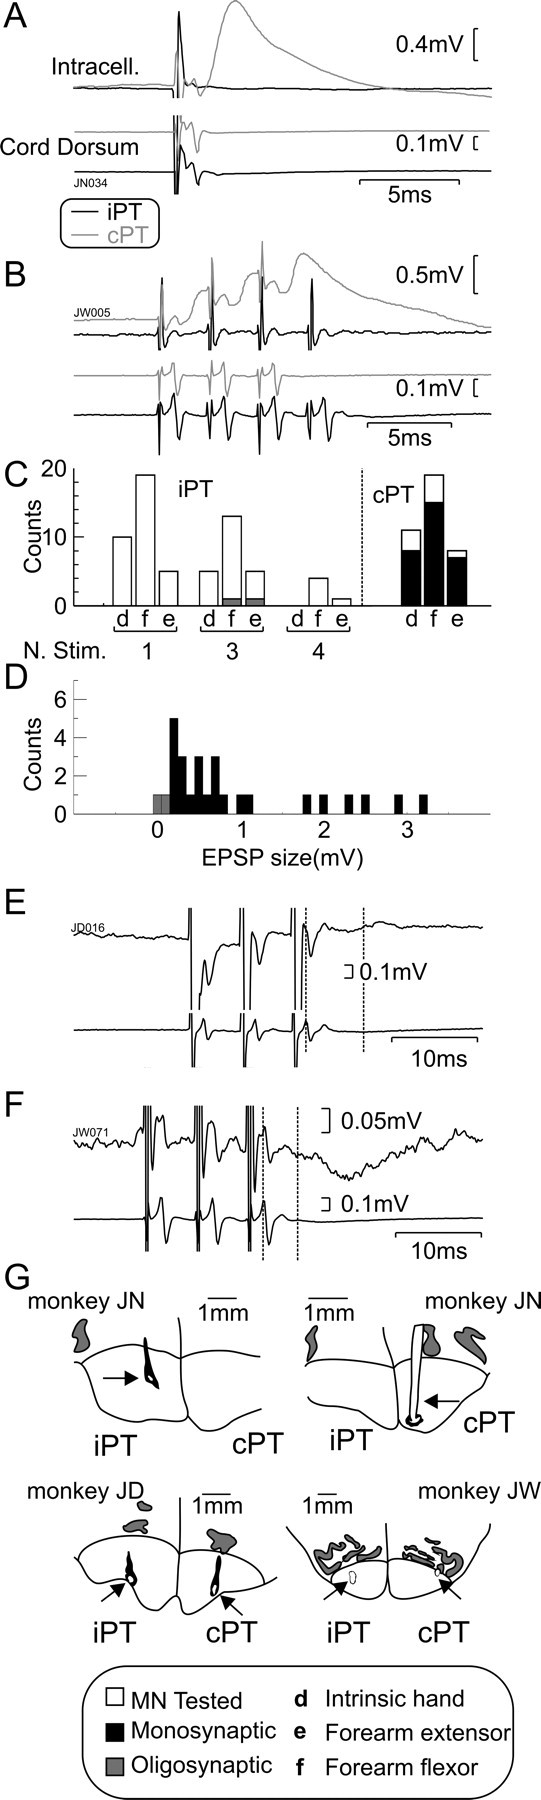
Intracellular motoneuron responses to PT stimulation. A, Example averaged intracellular recordings (intracell.) from a forearm flexor motoneuron in which an EPSP is evoked by a single stimulus to cPT (n = 36) but not to iPT (n = 37). B, Averaged intracellular recordings from a different forearm flexor motoneuron showing EPSPs evoked by multiple stimuli to cPT (3 stimuli; n = 30) but not to iPT (4 stimuli; n = 55). C, Histogram showing the types of motoneurons tested with iPT/cPT and the maximum number of stimuli (N. Stim.) used. Bars to the right of the dotted line correspond to cPT (single stimulus). Gray bars, Oligosynaptic responses; black bars, monosynaptic responses; white bars, no responses. D, Distribution of postsynaptic response amplitudes from PT stimulation. Black bars, cPT effects; gray bars, iPT effects seen. E, Example of weak polysynaptic facilitatory response after a train of three stimuli to iPT. F, Example of weak polysynaptic inhibitory response to a train of three stimuli to iPT. G, Drawings showing the locations of tips of PT stimulating electrodes (arrows) reconstructed from histology. In A, B, E, and F, intracellular recordings are shown above cord dorsum records. In E and F, dotted vertical lines indicate the arrival of the PT volley to the cord and the measured onset of the response.