
Figure 2.
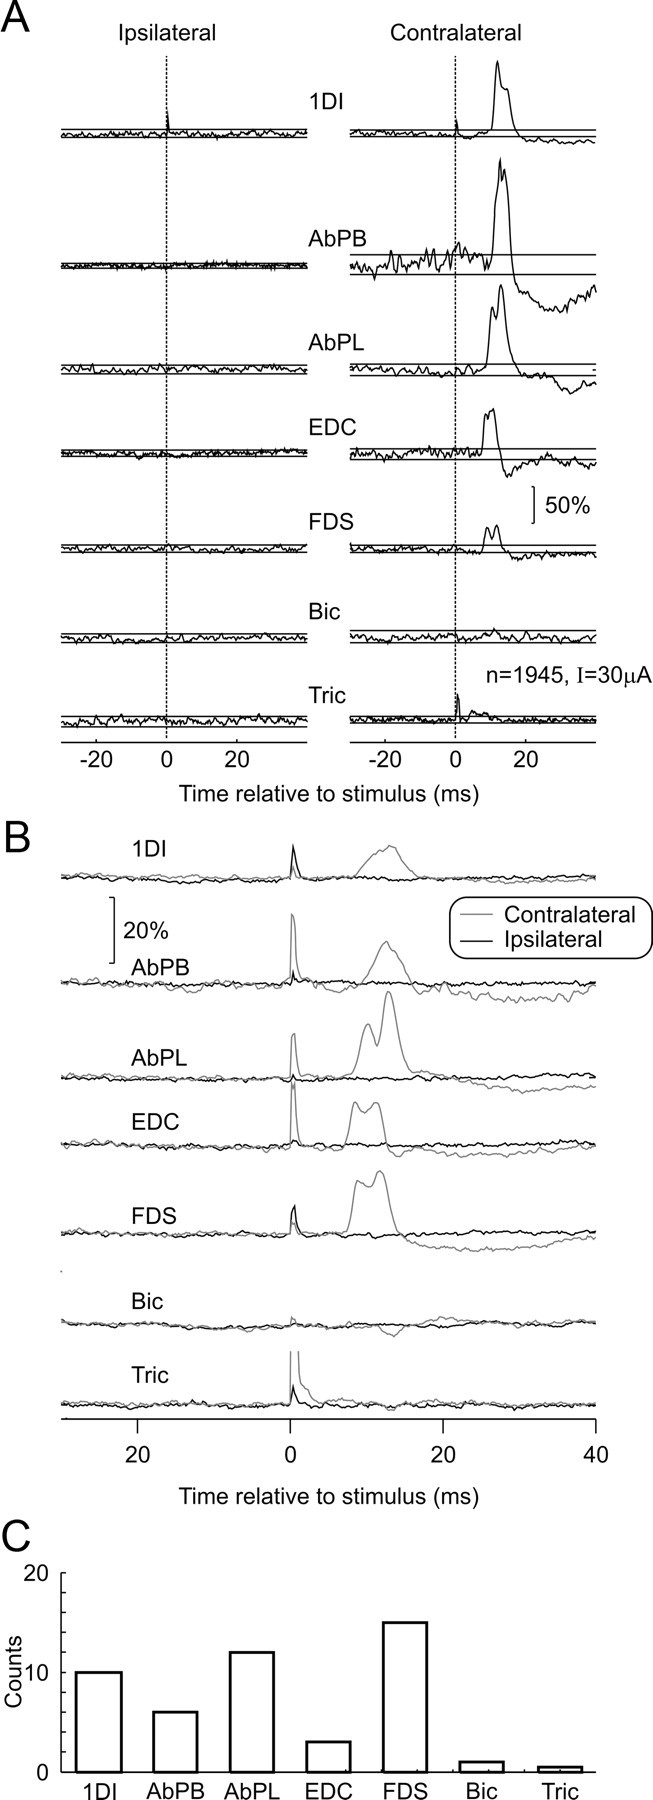
Responses to single-pulse intracortical microstimulation in M1. A, Average EMG responses evoked by sICMS delivered to a single site in M1 (intensity, 30 μA) while the monkey was performing the behavioral task. Traces are normalized as a percentage of the mean baseline level. B, Average across all 23 stimulation sites (black, ipsilateral muscles; gray, contralateral muscles). C, Frequency of effects in different contralateral muscles. Bic, Biceps; Tric, triceps.