
Figure 3.
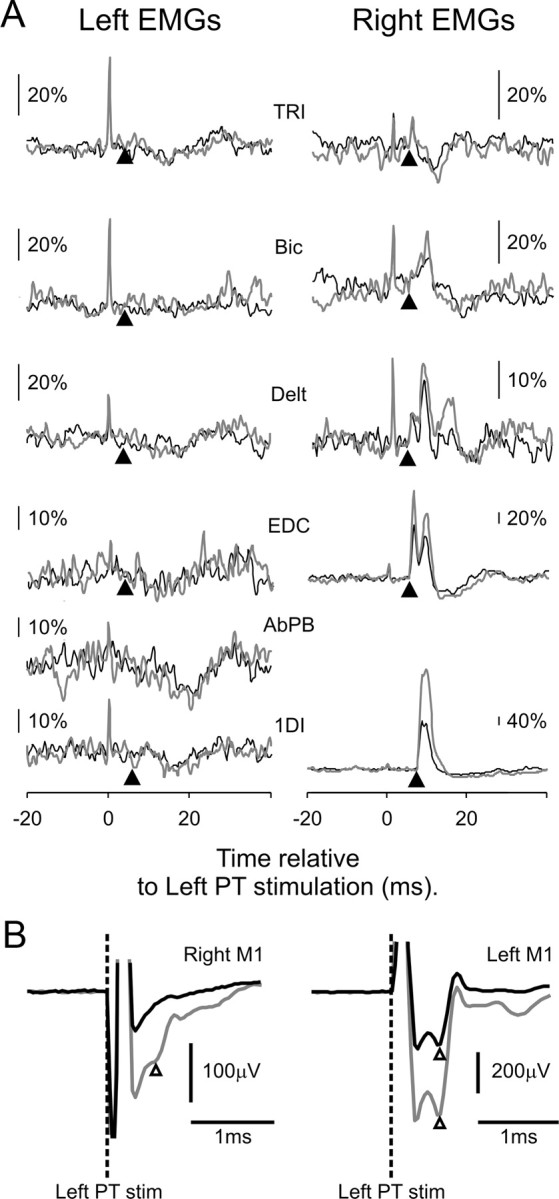
Responses to single-pulse stimulation of the PT. A, Stimulus-triggered averages of bilateral rectified EMGs, using left PT stimulation at intensities of 500 μA (black) and 1000 μA (gray); n = 1511 and 919, respectively. The arrowheads under each trace indicate the onset latency of the response in that muscle after stimulation on the contralateral side. TRI, Triceps; Bic, biceps; Delt, deltoid. B, Antidromic field potentials (onsets marked by white arrowheads) recorded from M1 bilaterally following left PT stimulation (PT stim; indicated by dashed lines). Note that 500 μA stimuli evoked a response in left M1 only (black traces), whereas stimulation at 1000 μA (gray traces) also elicited a small response on the left side, indicating stimulus spread to the contralateral PT.