
Figure 4.
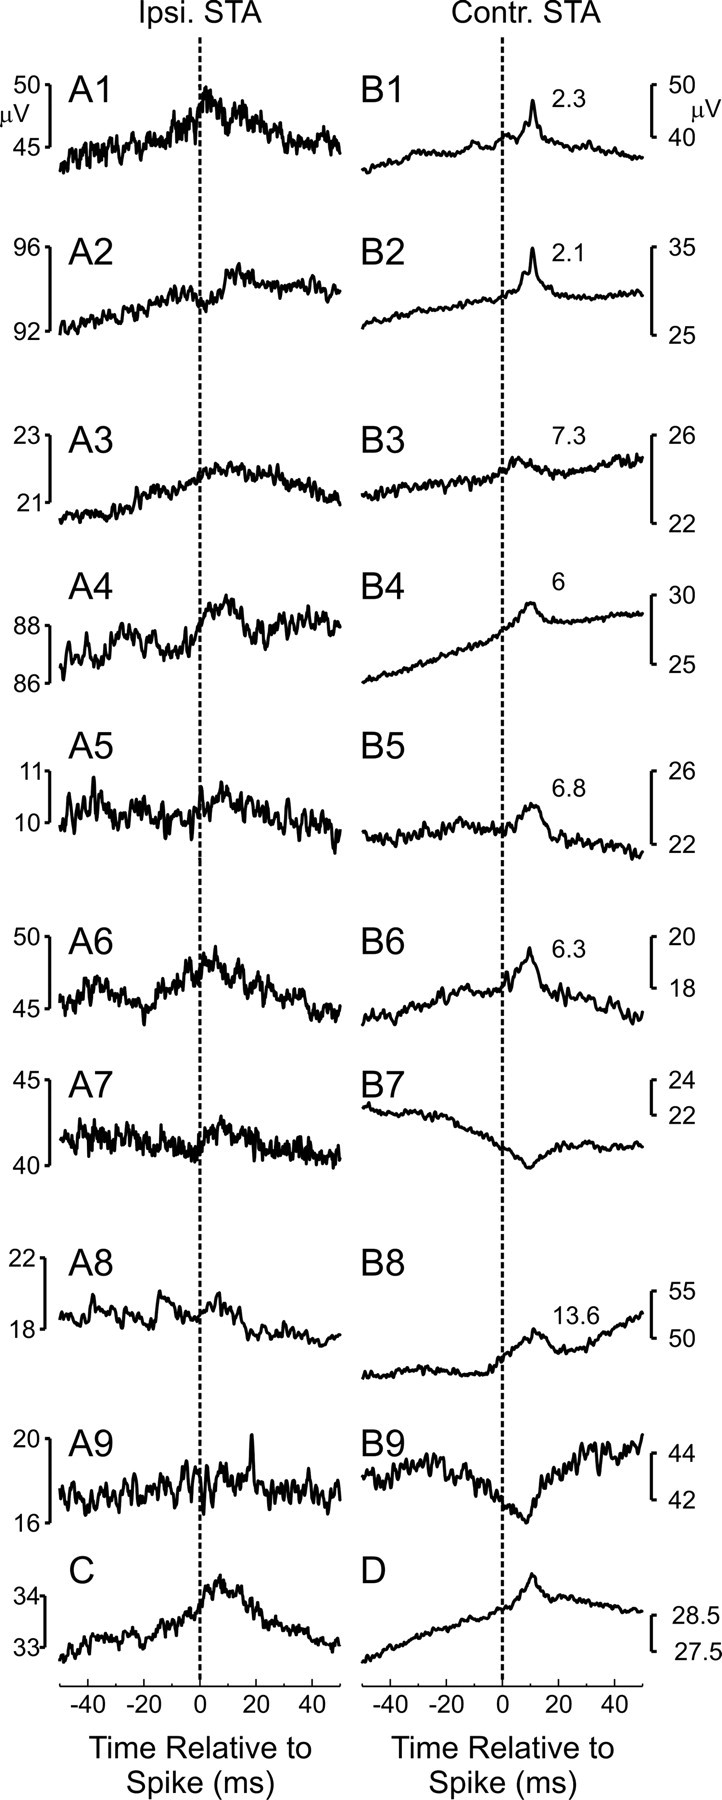
Spike-triggered averages of EMG from M1 cell activity. A1–A9, Nine example ipsilateral averages showing the clearest significant effects found. B1–B9, Same as A1–A9 but for contralateral muscles. C, Average across all significant ipsilateral effects. D, Average across all significant contralateral effects. Note that the averages are differently scaled. The numbers to the right of the contralateral effects correspond to the peak width at half-maximum.