
Figure 5.
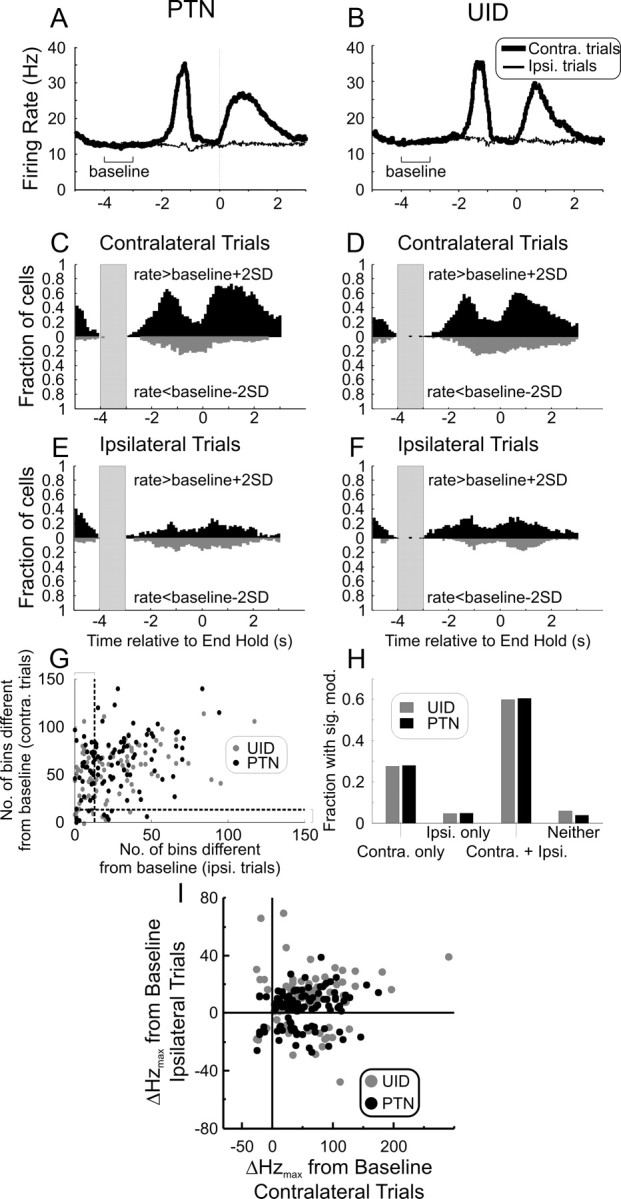
Task-related activity of cells in M1 during ipsilateral (Ipsi.) and contralateral (Contra.) limb movements. A, Mean PSTH of 104 PTNs during ipsilateral (thin line) and contralateral (thick line) trials aligned to the End Hold task marker. B, Same as A but for 87 UIDs. C, Number of bins across the population of PTNs with rates higher than baseline plus 2 SD (upward, black bars) and with rates lower than baseline minus 2 SD (downward, gray bars) for contralateral trials. D, Same as C but for UIDs. E, Same as B but for ipsilateral trials. F, Same as D but for ipsilateral trials. The shaded area in C–F indicates the region used as baseline. Cell activity aligned to end of hold event (time 0). The time axis is the same for A–F. G, Cluster plot of the number of bins crossing the 2 SD limit for ipsilateral and contralateral trials. Each dot corresponds to a single neuron (gray, UIDs; black, PTNs). The vertical and horizontal dotted lines indicate the minimum number of bins needed before a cell can be judged to have significant modulation with the particular trial. H, Histogram of the number of cells showing modulation with the different trial lateralities. Simply by chance, we would expect a certain number of false positives in each category, and only the Contra. only and Contra. + Ipsi. categories have counts above the number expected by chance. I, Cluster plot of maximal rate modulation during ipsilateral (ordinate axis) and contralateral (abscissa) trials for PTNs and UIDs. The rate modulation is defined as the maximal absolute deviation relative to a baseline epoch. For both PTNs and UIDs during contralateral trials, the majority showed a rate increase; for ipsilateral trials, a higher proportion of cells showed a rate suppression.