
Figure 7.
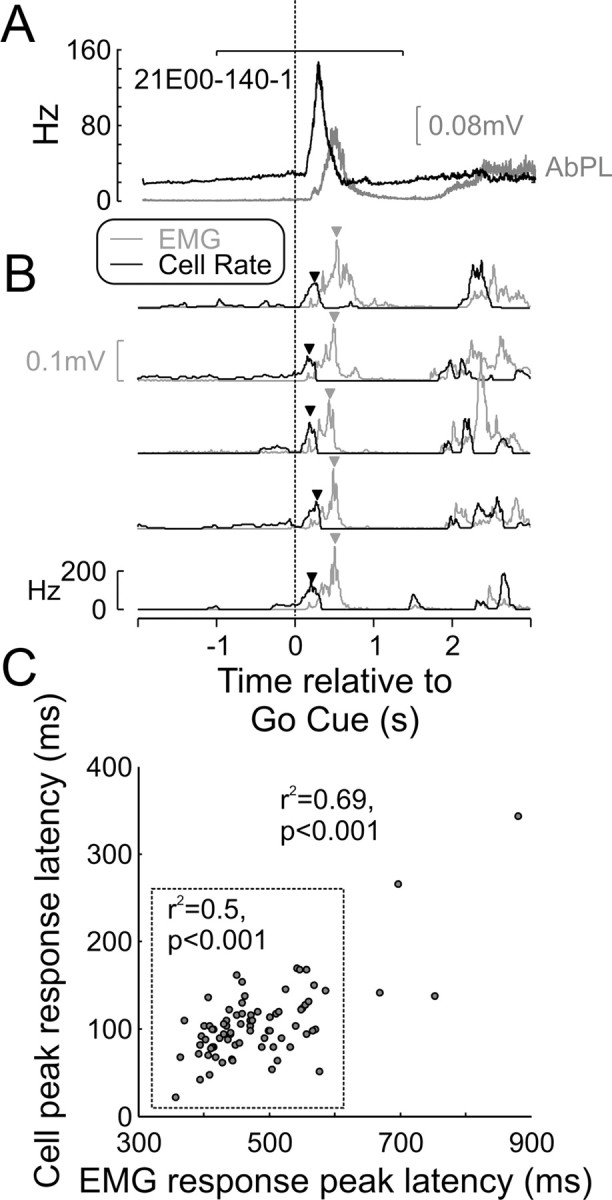
Latency correlation between M1 cell activity and EMG. A, Mean EMG activity of contralateral AbPL (gray line) and PSTH of M1 PTN (black line) aligned to the Go Cue. The horizontal bar at the top indicates the region used to search for the peak in cell and EMG response on a trial-by-trial basis. B, Five example trials showing the cell's instantaneous firing rate (black line) and EMG activity (gray line), with triangles indicating peak response times of both. C, Cluster plot showing good correlation between EMG peak response latency and neuronal peak response latency. When including all trials, the correlation coefficient was 0.69, and when extreme values (data points outside the dotted square) were excluded, this correlation was still highly significant at 0.5.