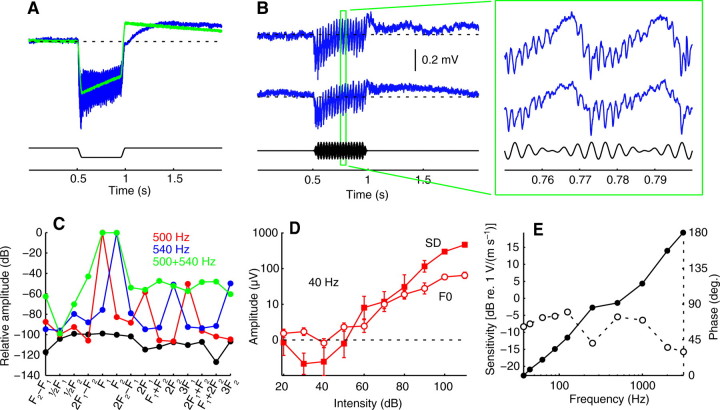
Fig. 1.
(A) The response of the amplifier alone (green) to a negative square pulse with no carrier (black). The neural response (blue) to a 500 Hz carrier modulated by the same square pulse is provided for comparison. Both the amplifier and neural recording decay with a time constant of ~1.6 s because of a 0.1 Hz high-pass filter in the amplifier. (B) Control recordings in the head capsule, both without (upper) and with (lower) a second electrode in the ipsilateral Johnston's organ. The contralateral Johnston's organ was removed. Shown below in black is the 250+290 Hz, 110 dB stimulus. (C) Distortion products (green) in the stimulus delivery system generated by playing 500 and 540 Hz simultaneously at 110 dB, overlaid with the distortion generated by the same tones presented separately (red and blue). The noise floor is in black. (D) Intensity tuning curves averaged (±s.e.m.) over nine females showing the threshold at which the sustained deflection (SD, closed squares) and periodic oscillation (F0, open circles) components of the response to tones at 40 Hz exceed pre-stimulus background noise (dashed line at zero). (E) The magnitude (closed circles) and phase (open circles) response of the pressure-gradient microphone used to calibrate the speaker.

