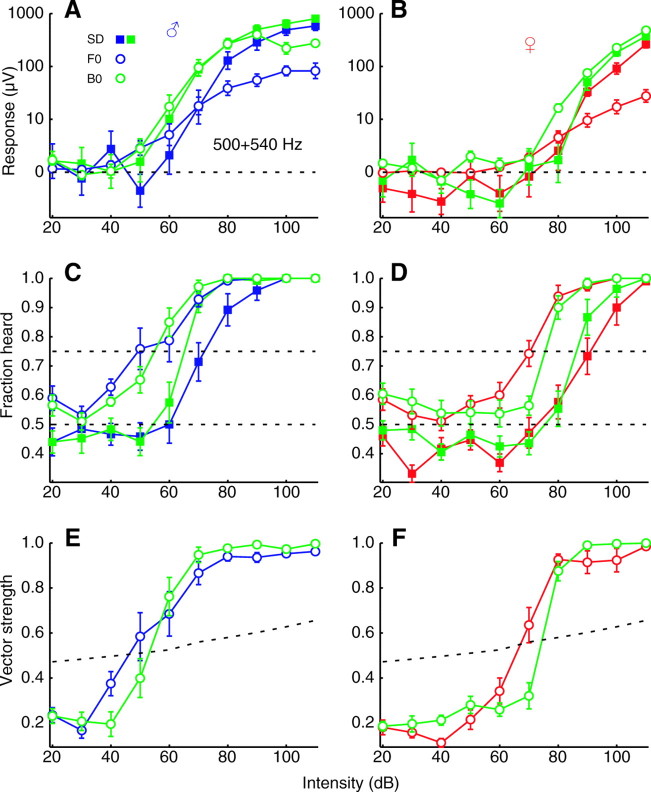
Fig. 4.
(A) The response to one- and two-tone stimuli in which the frequencies were fixed at 500 and 540 Hz and intensity was varied. Symbol scheme is the same as that in Fig. 3. Intensities shown for two-tone stimuli are for just one of their constituent tones, the overall intensity then being 3 dB higher. Values are means ± s.e.m. for 10 males (C) Neurometric functions for the same data as in A. Dashed lines indicate chance level at 50% and threshold criterion at 75%. (E) Vector strengths for the same data as in A. Dashed line indicates significance at P<0.01. (B,D,F) Same as A,C,E but for 10 females.

