
Fig. 5.
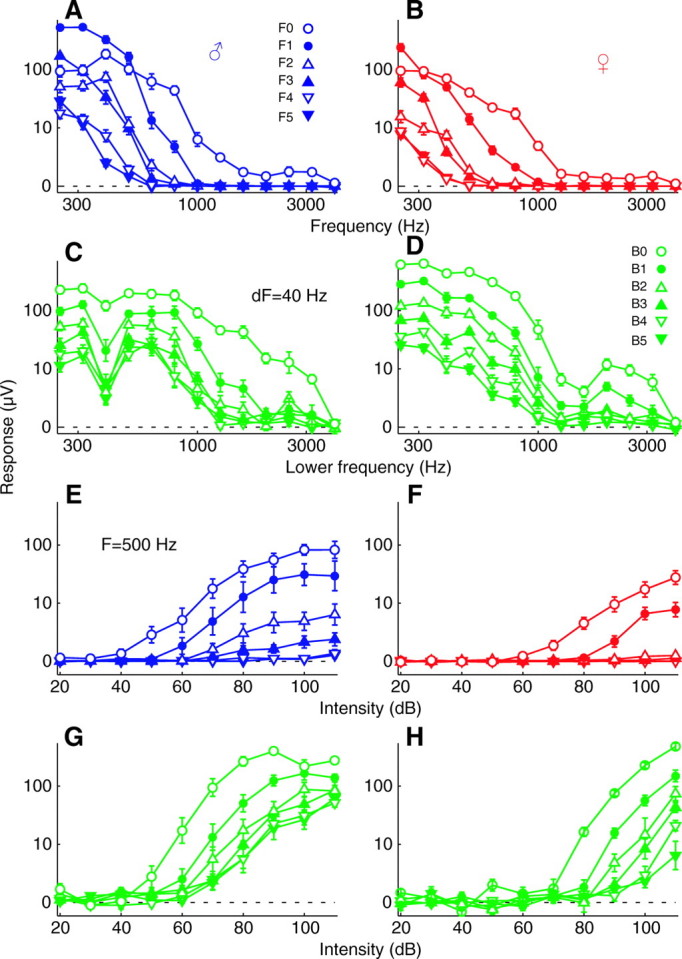
(A,B) The magnitude of periodic oscillations at the fundamental frequency (F0) and multiple harmonics (F1–5) in response to a one-tone stimulus as a function of stimulus frequency and sex. (C,D) The magnitude of additional periodic oscillations at the difference, or beat, frequency (B0) and its harmonics (B1–5) in response to a pair of tones presented simultaneously. (E–H) Same as A–D but as a function of intensity. Intensity in A and B is 110 dB and in C and D 113 dB; frequency in E and F is 500 Hz and in G and H 500 and 540 Hz. Values are means ± s.e.m. for the same data as in Figs 3 and 4.