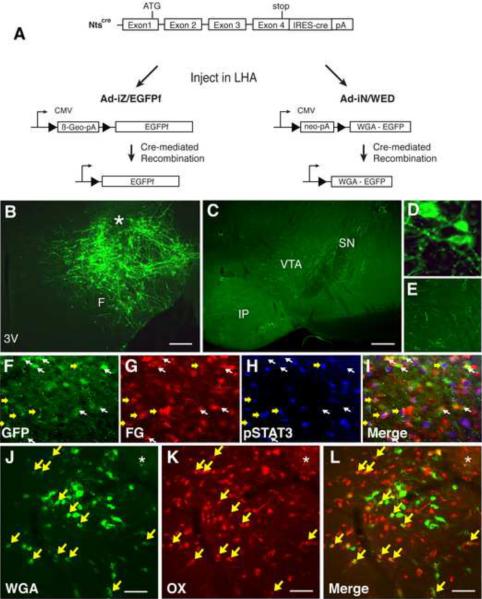
Figure 5. LHA Nts neurons project to the VTA and within the LHA onto OX neurons.
(A) Schematic diagram showing cre-mediated expression of EGFPf and WGA in infected Nts-expressing neurons following stereotaxic injection of Ad-iZ/EGFPf or Ad-IN/WED, respectively, into the LHA of Ntscre mice. (B) Immunofluorescent detection of EGFPf in the LHA of Ntscre mice following intra-LHA injection of Ad-iZ/EGFPf identifies cell bodies and fibers (projections) in the LHA. (C) Immunofluorescent detection of EGFPf in the VTA of Ntscre mice after intra-LHA injection of Ad-iZ/EGFPf. (D, E) Enlargements of B and D, respectively. (F–I) LHA images from leptin-treated (2h, IP, 5 mg/kg) NtsEGFP mice injected with the retrograde tracer FG in the VTA. (F) GFP-IR, (G) FG-IR, (H) pSTAT3-IR, and (I) merged image. Yellow arrows indicate neurons positive for pSTAT3, FG and GFP. White arrows identify GFP+FG neurons that do not contain pSTAT3. (J–L) LHA from an Ntscre mouse injected with Ad-IN/WED. (J) Immunofluoresence for WGA (green), (K) OX (red), and (L) merged. Yellow arrows: neurons that contain OX + WGA. Scale bars in (B) = 100 μm. F= fornix; 3V = third cerebral ventricle; VTA = ventral tegmental area; SN = substantia nigra (pars compacta); IP= interpeduncular tubercle; * = injection site.

