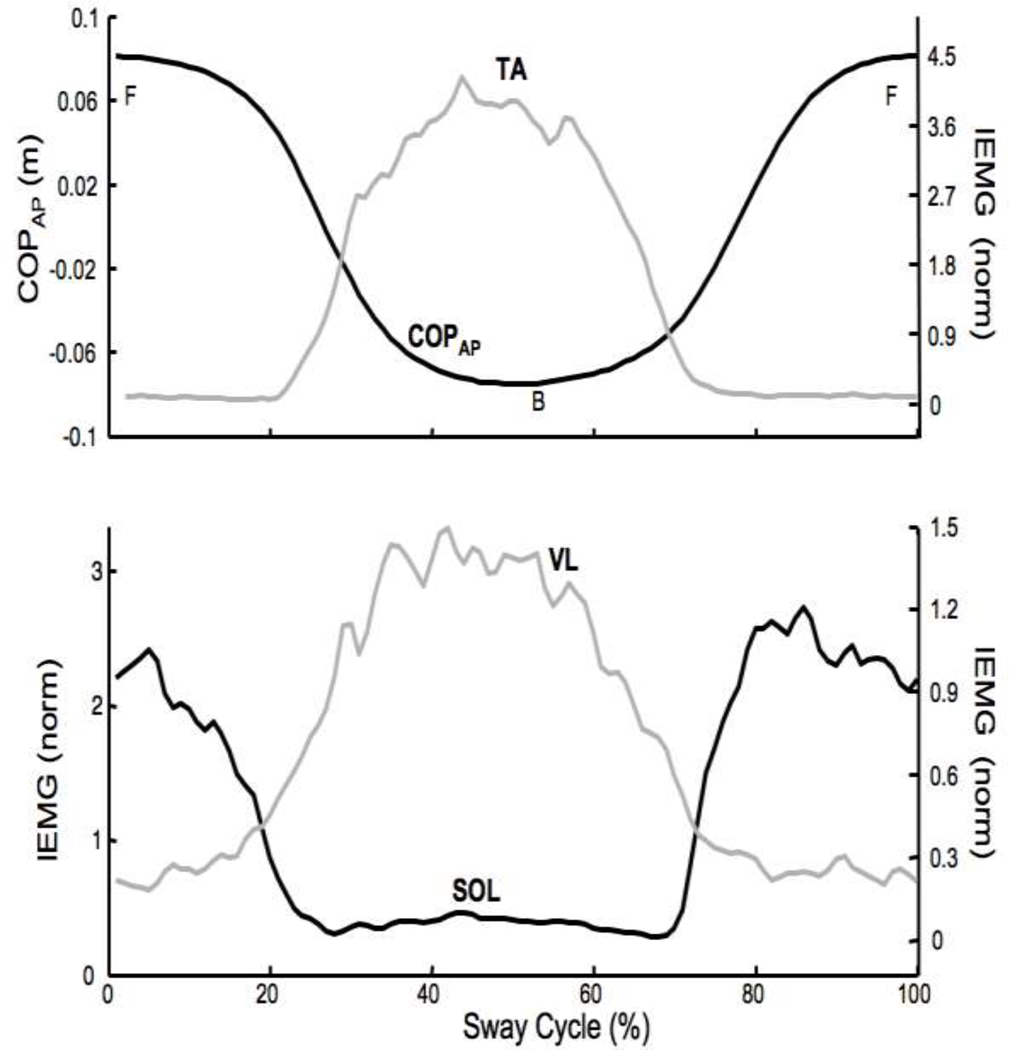
Figure 3.
Typical IEMGnorm and COPAP time profiles for a representative participant. The data were averaged at each 1/100th time-point over all the accepted cycles. Top: COPAP displacement (m) and IEMGnorm for tibialis anterior (TA) muscle. Bottom: IEMGnorm for soleus (SOL) and vastus lateralis (VL). F – forward; B – backward.

