
Figure 7.
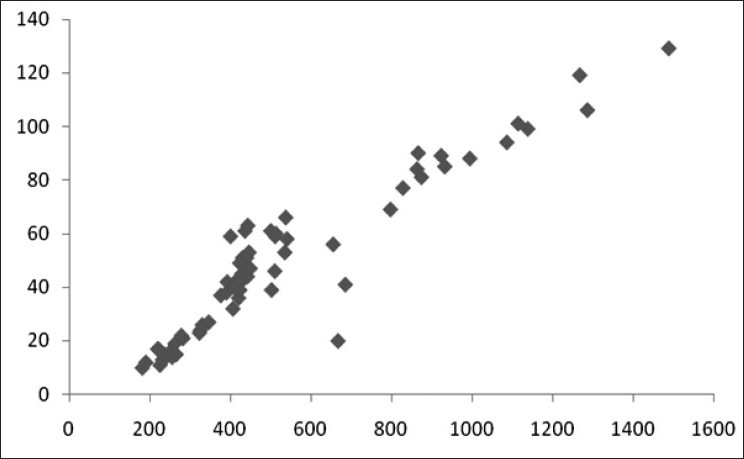
Scatter diagram showing correlation of CPK (in IU/L) and total dose of atropine (in mg) (r=0.936)
Official websites use .gov
A
.gov website belongs to an official
government organization in the United States.
Secure .gov websites use HTTPS
A lock (
) or https:// means you've safely
connected to the .gov website. Share sensitive
information only on official, secure websites.
Scatter diagram showing correlation of CPK (in IU/L) and total dose of atropine (in mg) (r=0.936)