
Figure 8.
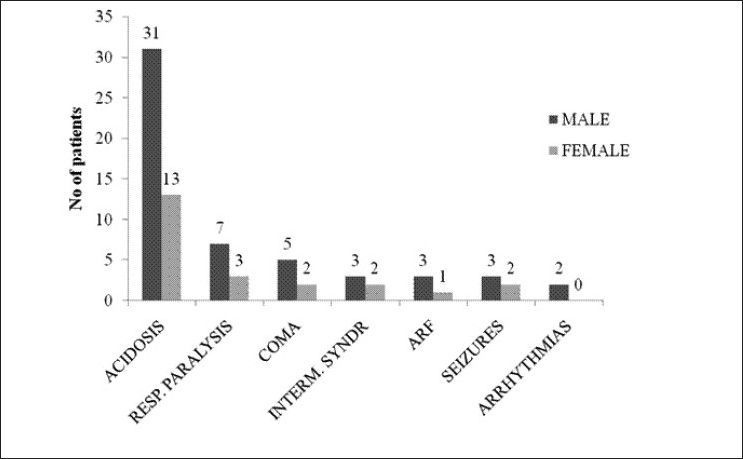
Bar diagram showing complications developing during the course of the study in the study population (n=63)
Official websites use .gov
A
.gov website belongs to an official
government organization in the United States.
Secure .gov websites use HTTPS
A lock (
) or https:// means you've safely
connected to the .gov website. Share sensitive
information only on official, secure websites.
Bar diagram showing complications developing during the course of the study in the study population (n=63)