Table 2.
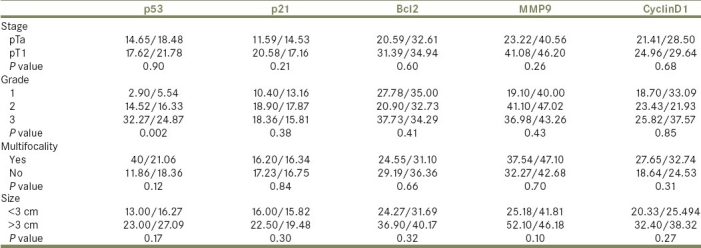
Markers’ mean percentage/standard deviation in relation to tumor pathological features: stage, grade, multifocality, and size

Markers’ mean percentage/standard deviation in relation to tumor pathological features: stage, grade, multifocality, and size
