
Figure 5.
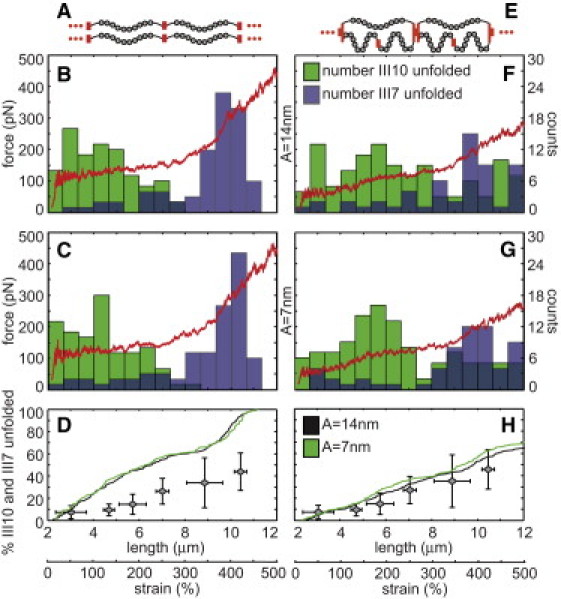
Two computational models of Fn fibers were generated that consisted of either a linear series of 20 molecules in parallel with another linear series of 20 molecules (A–D) or 20 units of three molecules per unit, each with a molecule in parallel with a linear series of two molecules (E–H). Fibers were stretched from a resting end-to-end length of 2.4 μm to a final length of 12 μm. At each of 20,000 discrete steps during the strain cycle, the node positions between each of the molecules were determined by minimizing the potential energy of the system (Eq. 4). A random number was used to determine whether modules unfolded. Force was plotted versus fiber length (red curves) assuming the folded Fn molecule had a persistence length of 14 (B and F) or 7 nm (C and G), and the total number of unfolded FnIII7 (blue boxes) and III10 modules (green boxes) was tracked and plotted within 0.667 μm bins (B, C, F, and G). Cumulative histograms of the total percentage of all FnIII7 and III10 modules in each fiber were plotted versus fiber length (D and H). The in vitro cysteine exposure averages (gray diamonds from Fig. 2E) were plotted on top of the in silico unfolding curves for comparative purposes.