
Figure 2.
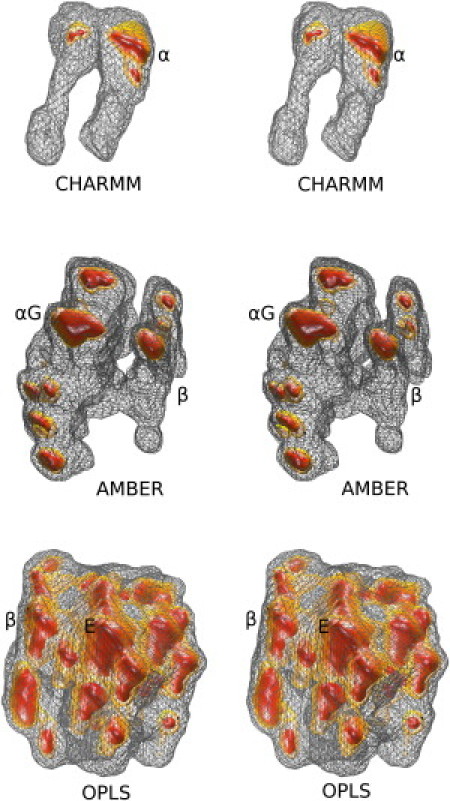
Three-dimensional folding landscapes. Wall-eyed stereodiagrams of the projection of the three trajectories on the space defined by the top three eigenvectors as obtained from dihedral principal component analysis with the program CARMA. For each diagram, three isosurfaces are shown, drawn at mean density (wireframe), 2σ above mean (light surface), and 4σ above mean (dark surface) of the corresponding distributions. (The structural assignments of the most prominent peaks are also shown with α for α-helix, αG for a mixture of α-helix and 310-helix, β for β-hairpin structure, and E for extended structure.)