
Figure 2.
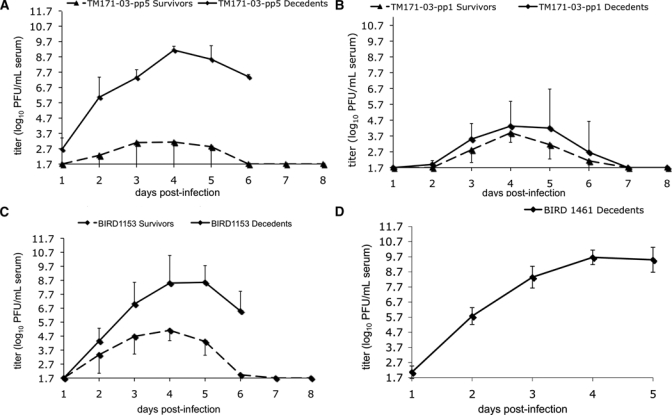
Mean (±SD) viremia profile comparisons for American crows inoculated with A, TM171-03-pp1, B, TM171-03-pp5; C, BIRD1153; and D, BIRD1461 West Nile viruses. Triangles indicate survivors and boxes indicate decedents. Bars represent SDs from the means. Either positive or negative error bars are presented for clarity. PFU = plaque-forming units.