
Figure 3.
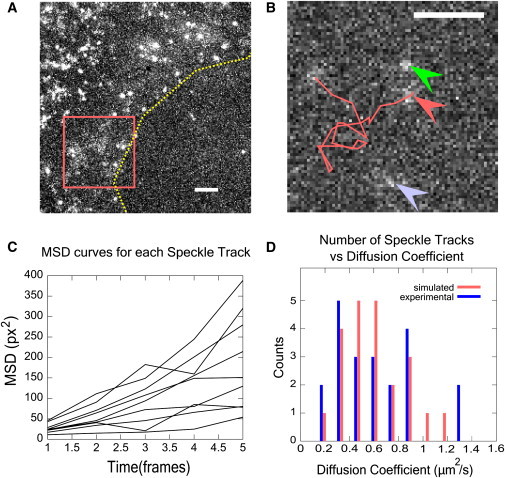
Tracking diffusing CPs at the leading edge of XTC cells. (A) Maximum intensity projection from a time-lapse recording of GFP-labeled CP at the leading edge. (Dashed line) Outline of leading edge. Exposure time was 66 ms and 1 pixel = 80 nm. Diffuse structures are diffusing molecules. (Bright speckles) CP proteins bound to the actin meshwork. (B) Enlarged section of box of panel A, single frame. (Line) Trace of a speckle track. (Middle arrow) Start of track. (Top arrow) Another diffusing speckle. (Bottom arrow) Cloud too mobile to track for enough frames. (C) MSD plots for individual speckle tracks from the time-lapse recording. (D) Distribution of diffusion coefficients found by fitting individual MSD curves with straight lines. Experimental: 22 tracked CPs. Simulated: results of tracking simulated particles for 10 frames with comparable conditions to the experiment: D = 0.6 μm2/s, 66 ms exposure, 1 px = 80 nm. Bin sizes are 0.14 μm2/s. Scale bars, 2 μm.