
Figure 5.
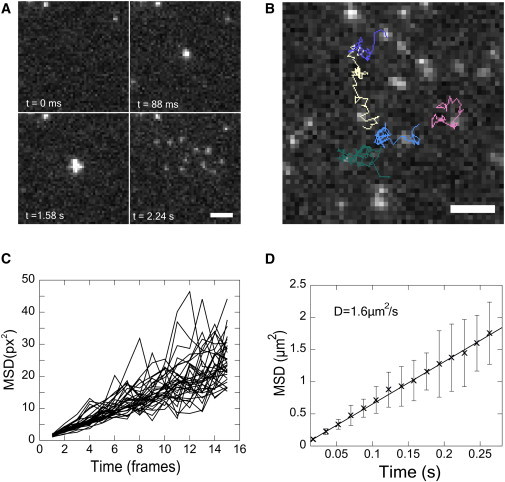
Single lipid tracking following vesicle fusion on a supported bilayer. (A) Montage of TIRFM images. (Top left) Before docking; (top right) docking; (bottom left) shortly after fusion; (bottom right) more time after fusion. Released lipids diffuse on the membrane. Residual lipids from prior fusion events can be seen in the first frame. (B) Image of tracked lipids. Images taken at 67 frames/s. (C) MSD for individual lipid trajectories. (D) Averaged MSD plots and linear fit from 33 lipids tracked for at least 30 frames. Error bars are 1 SD of the mean. Scale: 2.67 μm (10 pixels).