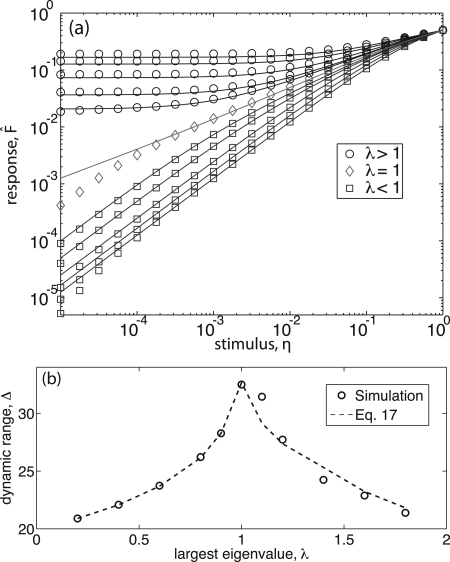
Figure 3.
(Color online) Simulation data for scale-free networks of 104 nodes (symbols) and numerical solution of Eq. 17 (lines). (a) Stimulus vs response predictions agree well in the regime where Ap≈su, as discussed in Sec. 6C. Eigenvalues range from 0.2 to 0.9 (blue squares), exactly 1.0 (red diamonds), and from 1.1 to 1.8 (black circles). (b) Dynamic range predictions capture maximization at λ=1 as well as the non-critical behavior.

