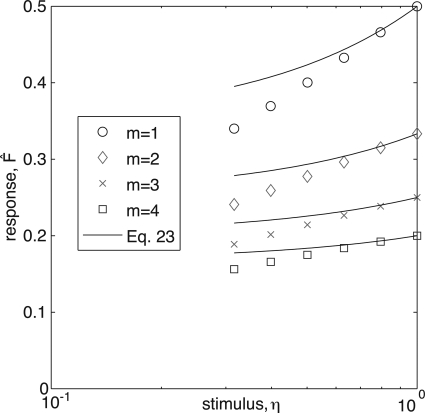
Figure 5.
(Color online) Simulation data (symbols) compare reasonably with the prediction of the perturbative approximation close to saturation, Eq. 23, for different refractory states. δη was chosen to be the different between η=100 and η=10-0.1, corresponding to the two rightmost data points of each simulation.

