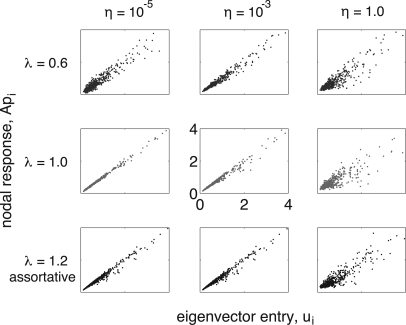
Figure 7.
(Color online) Plots of normalized Api vs sui for scale-free networks, with eigenvalues 0.6 (blue, top row), 1.0 (red, middle row), and 1.2 with assortative mixing (black, bottom row) at stimulus levels η=10-5,10-3, and 1 for the left, middle, and center columns, respectively. Agreement is very good for critical and active cases, with more noise in the quiescent case due to less incoming stimuli over the duration of the simulation.

