
Figure 2.
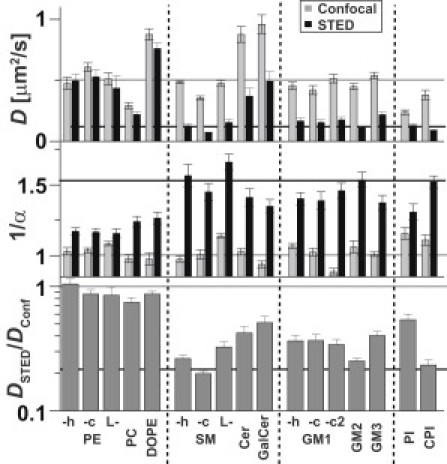
Structural dependence of the nanoscale trapping. Apparent diffusion coefficient D (upper panel) and anomaly 1/α (middle panel) determined from confocal (d = 240 nm, gray bars) and STED FCS recordings (d = 40 nm, black bars), and ratio DSTED/Dconf (lower panel) for the various fluorescent lipid analogs. DSTED/Dconf = 1 for normal free diffusion and <1 for nanoscale trapping (the smaller the DSTED/Dconf, the stronger the trapping).