
Figure 4.
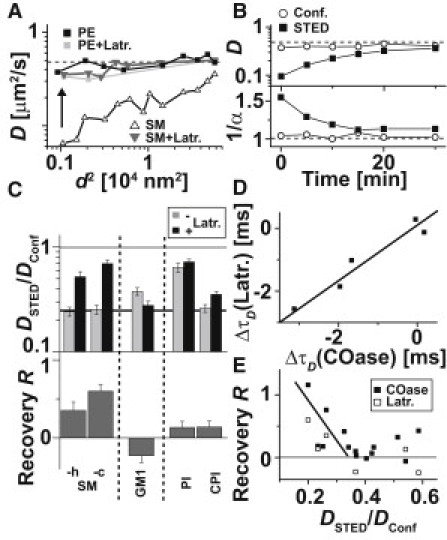
Lipid dynamics after actin depolymerization and correlation with cholesterol dependence and trapping strength. (A) Dependence of the apparent diffusion coefficient D of PE (squares) and SM (triangles) on the focal area d2 before (black) and after (gray) actin depolymerization by Latrunculin B (Latr.) treatment. (B) Time evolution of D (upper panel) and the anomaly 1/α (lower panel) of SM determined from the confocal (open circles) and STED (black squares, d = 40 nm) FCS data after starting treatment with Latrunculin B. (C) Ratio DSTED/Dconf and recovery R for various fluorescent lipid analogs upon Latrunculin B treatment. (D) Correlation of the cholesterol and actin dependence: value pairs of the changes in focal transit time ΔτD of the STED recordings (d = 40 nm) following COase and Latrunculin B treatment for different fluorescent lipid analogs. Negative values of ΔτD indicate abolishment of trapping. (E) Correlation of the trapping strength and the cholesterol and actin dependence: value pairs of the trapping strength DSTED/Dconf before treatment and the recovery R after treatment with COase (black) and Latrunculin B (white) for different fluorescent lipid analogs.