
Figure 1.
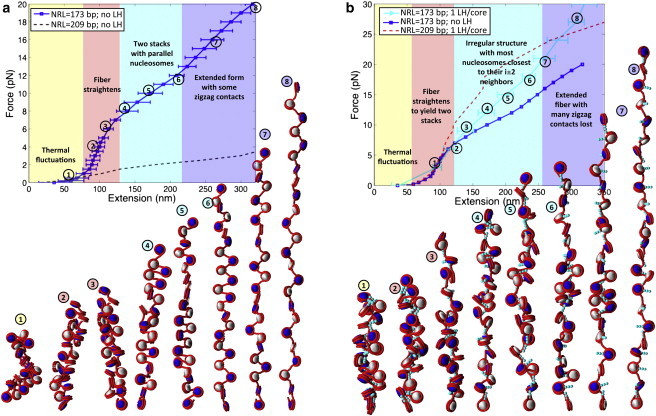
F-D curve of 24-unit 173-bp oligonucleosome chains at 0.15 M monovalent salt, and space-filling models based on MC stretching simulation snapshots of the same systems: (a) arrays without LH and (b) arrays with LH. (White and navy) Alternating nucleosomes. (Red) Wrapped DNA. (Turquoise) LH (see Fig. S1 in the Supporting Material). In the curve, different background colors and text describe the different stretching responses that the chromatin fiber exhibits as the pulling force increases, as revealed by the simulation snapshots. (Circled numbers) Relation of each snapshot with a point along the F-D curve.