
Figure 5.
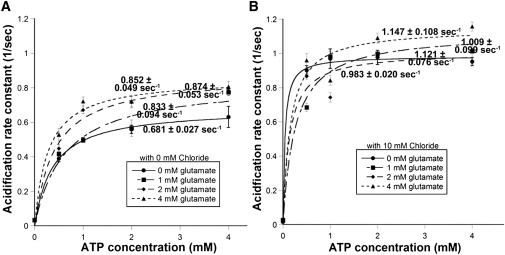
Effect of Cl− concentration on the kinetics of SpH vesicle acidification. (A) Rates of SpH acidification measured without Cl− at different ATP concentrations with 1 mM glutamate. Removal of chloride resulted in skewed distributions best fit by log-normal distributions (see Fig. S2C). Average acidification rates plotted against ATP concentration and fit with Michaelis-Menten function. The addition of glutamate increased the maximal acidification rate in a statistically significant manner (P < 0.0001 for each glutamate concentration). (B) SpH acidification rates measured in the presence of 10 mM Cl− (20 mM HEPES, 104 mM potassium acetate,10 mM KCl, 4 mM MgSO4, pH 7.4) at different ATP/glutamate concentrations. Presence of chloride produced normally distributed acidification rates (see Fig. S2D) from which average acidification rates were determined then plotted against ATP concentration and fit with Michaelis-Menten function. Addition of glutamate increased the acidification rate in a statistically significant manner (P < 0.005).