
Figure 3.
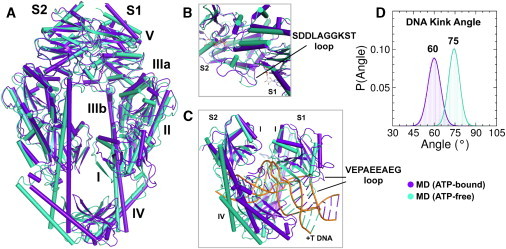
(A–C) Calculated average structures for MD on MutS⋅DNA(+T)⋅ATP (ATP-bound) (purple) and MutS⋅DNA(+T) (ATP-free) (cyan) complexes, with close-ups of the nucleotide- (B) and DNA-binding (C)sites. (D) DNA kink angles for ATP-bound (purple) and ATP-free (cyan) complexes.