Figure 2.

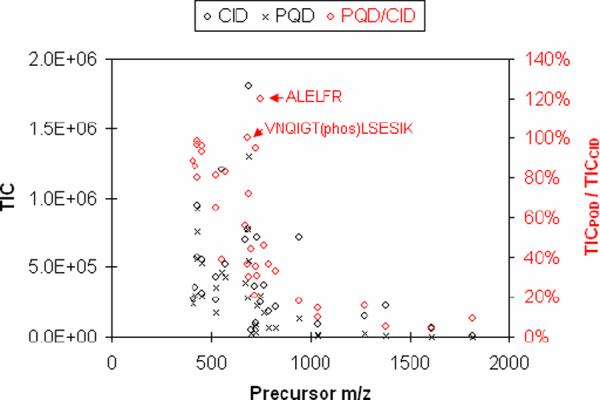
The levels of TIC of full-scan MSMS using CID (black diamond) or PQD (cross) at different precursor m/z (left y axis); and relative ratios of TICPQD/TICCID (red diamond), as indicated by the right y axis.

The levels of TIC of full-scan MSMS using CID (black diamond) or PQD (cross) at different precursor m/z (left y axis); and relative ratios of TICPQD/TICCID (red diamond), as indicated by the right y axis.