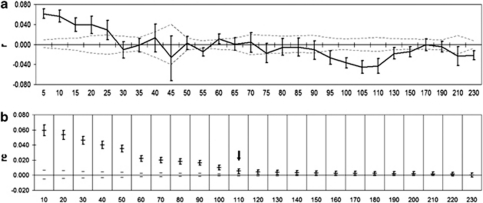
Figure 3.
Spatial genetic structure in Tasmanian devils sampled at seven sites on the east coast of Tasmania showing (a) correlogram plot of the correlation coefficient for all individuals along the East Coast as a function of distance; (b) the combined correlation coefficient of all individuals as a function of increasing distance. Error bars indicate 95% CI for r or rc as determined by bootstrapping, and dashed lines show the permuted 95% CI for the null hypothesis of no genetic structure. The arrow indicates the extent of detectable (significant) positive genetic structure.

