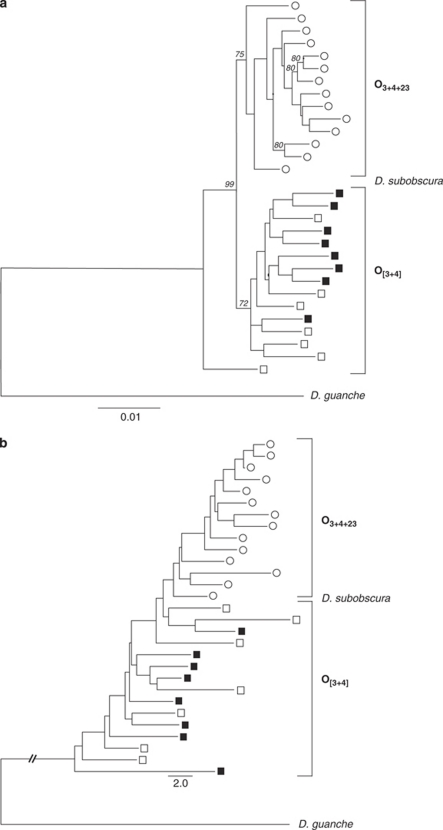
Figure 4.
(a) ML tree of the Obp83 region. Italic numbers indicate the percentage of bootstrap replicates (1000 replicates) supporting the main nodes (only bootstrap values higher than 70% are shown). (b) Neighbour joining tree of the Obp83 region. Trees were built using either nucleotide substitutions (a) or InDel events (b) information, and rooted with the D. guanche sequence. The scale bars in (a, b) indicate the number of substitutions per site and the number of InDel events, respectively. Lines from Bizerte and El Pedroso populations are depicted in white and black, respectively, whereas those of O[3+4] and O3+4+23 arrangements are represented by a square and a circle, respectively.

