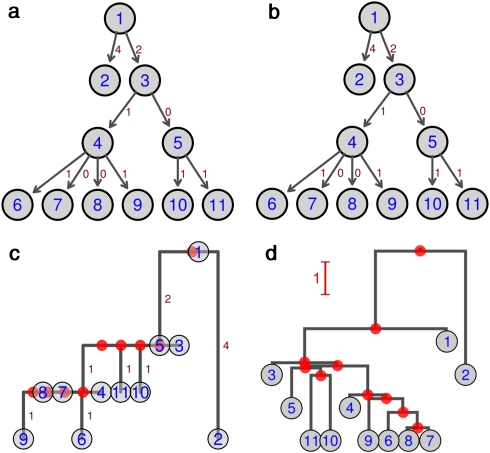
Figure 2.
Reconstruction of a simple simulated genealogy by two different approaches. This figure illustrates the reconstruction of a simulated genealogy (a) by SeqTrack (b), by a neighbor-joining phylogenetic tree based on nucleotidic distances, rooted with the most ancient isolate (c) and using the BEAST software (d). Circled numbers represent isolates. Arrows model real (a) or inferred (b) transmissions. The number of mutations between isolates is indicated in red at the right of the corresponding arrow (a, b) and branch (c). In d, branch lengths represent averages of the consensus tree, and are indicated by the red scale. Plain red dots represent hypothetical isolates inferred by phylogenetic reconstruction. A full color version of this figure is available at the Heredity Journal online

