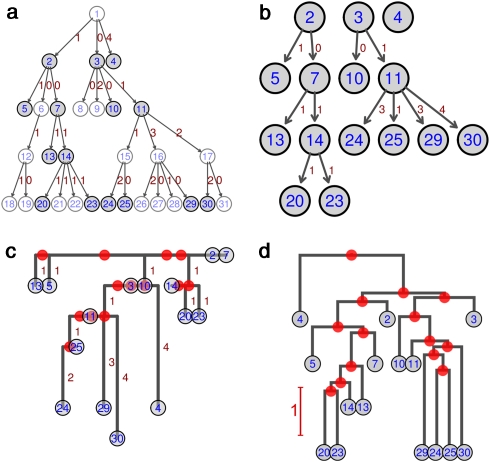
Figure 3.
Reconstruction of a sampled simulated genealogy by three different methods. This figure illustrates the reconstruction of a simulated genealogy from a sample of isolates, using the same representations as in Figure 2. (a) True genealogy, with sampled isolates indicated in darker tones. (b) SeqTrack results. (c) Results of a neighbor-joining phylogenetic tree based on nucleotidic distances, rooted with one of the most ancient isolates (2). (d) Results obtained with the BEAST software.

