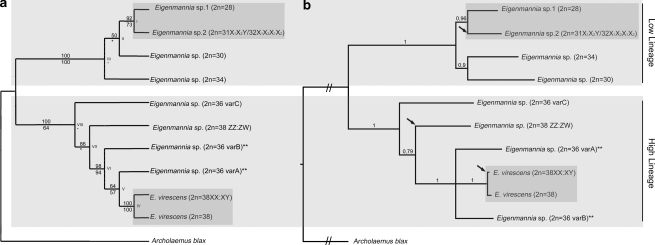
Figure 3.
(a) Phylogenetic trees obtained by maximum parsimony (MP) and maximum likelihood (ML). MP and ML bootstrap values are shown, respectively, above and below the branches. Nodes not shared by both methods are labeled by *. (b) Partitioned Bayesian analysis. Posterior probabilities are shown above the branches. The species pairs used in the cross-painting experiments are highlighted and the taxa included in the E. trillineata species group (see Materials and methods section and Table 1) are labeled by **. Arrows in (b) indicate most parsimonious origin of sex chromosomes.

