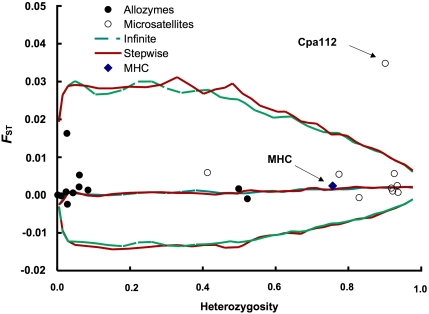
Figure 2.
FST for individual microsatellite, allozyme and MHC loci plotted against heterozygosity. Lines denote the 2.5, 50 and 97.5 percentiles of simulation-based expected distributions of FST assuming an infinite allele or stepwise mutation model, respectively. The simulations were based on the combined overall FST=0.002 for all three marker types.

