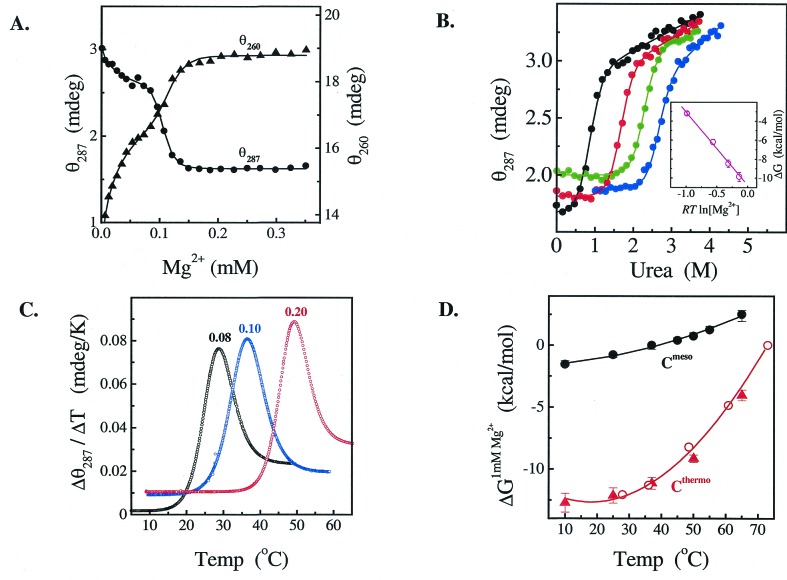
Figure 3.
Structural transitions of Cthermo. (A) Mg2+-titration monitored by CD at 260 and 287 nm at 37°C. The KMg and n values are the same at both wavelengths. (B) Urea titrations at Mg2+ concentrations of 0.2 (black), 0.4 (red), 0.6 (green), and 0.8 mM (blue). All experiments were performed in 20 mM Tris⋅HCl, pH 8.1, 0.3 μM RNA, 37°C. (Inset) Stability extrapolated to 0 M urea vs. RTln[Mg2+]. The slope of this plot is the Hill constant, n = 7.8 ± 0.3. (C) Temperature melting at the indicated, constant Mg2+ concentration (in mM) monitored by CD at 287 nm. (D) Temperature dependence of the Mg2+ midpoint for the observed I-to-N transition. KMg was obtained either from Mg2+-titrations at fixed temperature (circles) or from temperature melting at fixed Mg2+ concentrations (triangles). The heat capacity change, ΔCp, was obtained from the temperature-dependent stability, ΔG(T) = ΔH* − TΔS* + ΔCp[(T − 300) − T ln(T/300)], where ΔH* and ΔS* are the enthalpy and entropy changes at 300 K.

