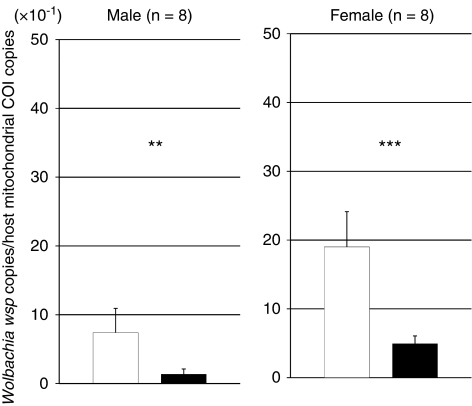
Figure 2.
Relative infection densities of wOus1 and wOus2 in the abdomens of superinfected individuals. White bars: wOus1; black bars: wOus2. Different letters indicate statistically significant differences (Student's t-test, **P<0.01, ***P<0.001). Males and females were subjected to the statistical analysis separately.

