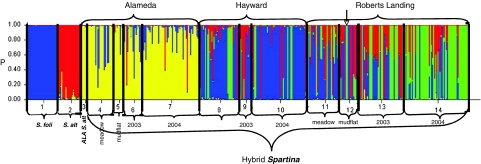
Figure 2.
Bar plot estimated by STRUCTURE depicting group membership (hybrid ancestry), representing each individual as a line segment. Each segment is partitioned into K=4 shaded (colored) components, representing the individual's estimated membership coefficients in the K clusters (y axis). Numbers (x axis) represent the initial geographic/demographic groupings: 1=S. foliosa, 2=S. alterniflora, 3=Alameda S. alterniflora, 4=Alameda meadow, 5=Alameda mudflat, 6=Alameda 2003 seedlings, 7=Alameda 2004 seedlings, 8=Hayward shoreline mudflat, 9=Hayward 2003 seedlings, 10=Hayward 2004 seedlings, 11=Robert's Landing meadow, 12=Robert's Landing mudflat, 13=Robert's Landing 2003 seedlings, 14=Robert's Landing 2004 seedlings. Arrow indicates Robert's Landing plant 14 (only green in group 12). A full color version of this figure is available at the Heredity Journal online.

