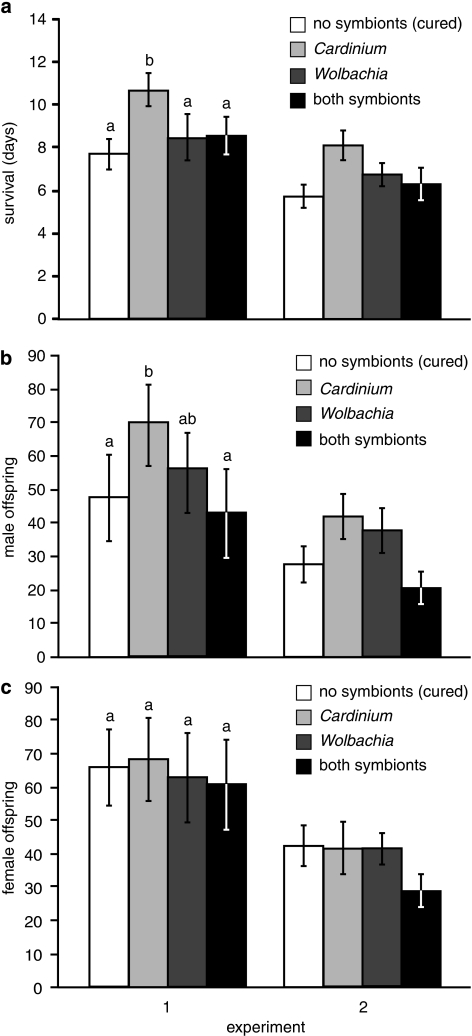
Figure 2.
Mean±s.e. survival (a), male (b) and female (c) offspring produced by differentially infected E. inaron over their lifetime. For each panel, lowercase letters above columns in experiment 1 denote treatments that differed significantly at α=0.05 in a two-way ANOVA that included both experiments.

