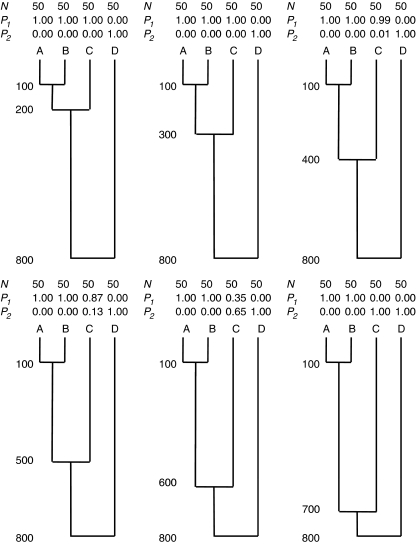
Figure 1.
The effect of evolutionary history on clustering. The numbers to the left of the six phylogenies are divergence times measured in generations before present (for example, populations A and B diverged 100 generations ago). Above each phylogeny are the sample sizes taken from each population (N), and the proportion of ancestry from those samples attributed to K=2 clusters (P1 and P2) by the program STRUCTURE 2.2.

