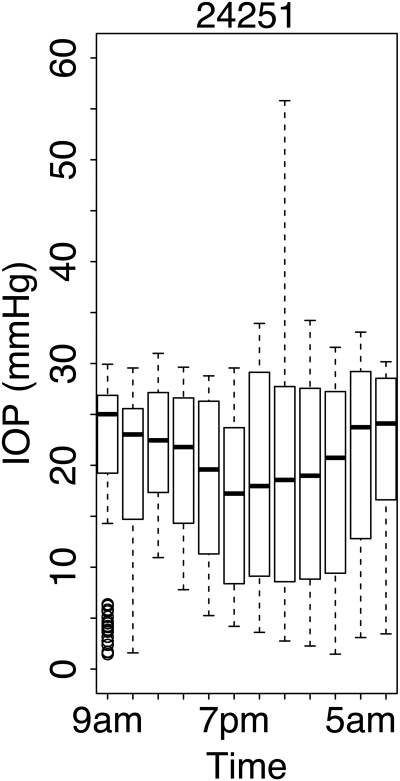
Figure 11.
The distribution of IOP in 2-hour time windows for four 24-hour periods in animal 24251. In the box-and-whisker plots, the central bar indicates the mean IOP in each 2-hour segment, the ends of the box show the central 50% of the measurements, and the whiskers indicate the 95% limits of the measurements in that time window; (○) outliers. Note that these data are derived from only four 24-hour periods of continuous IOP in this animal, because the IOP transducer failed prematurely. The data reported for this animal fall within the high-drift phase of the IOP transducer. Whereas we are confident that the relative patterns of IOP distribution shown are representative, the absolute IOP values should be viewed with caution (see Limitations section of the Discussion).

