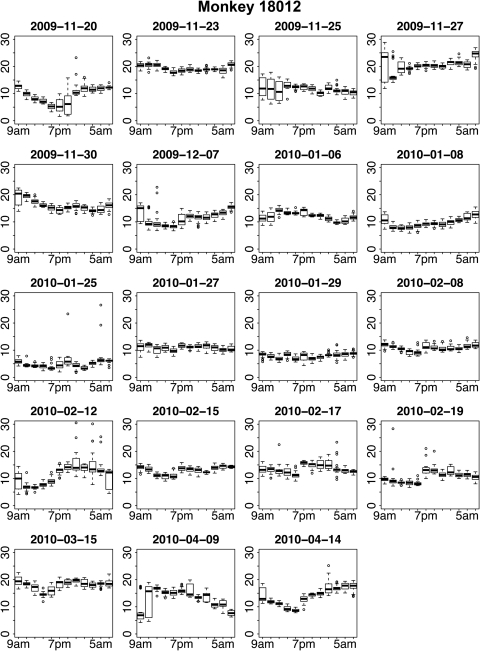
Figure 6.
The 2-hour time-window distributions of IOP for 19 24-hour periods in animal 18012. The dates of data capture are shown above each plot. In the box-and-whisker plots, the central bar indicates the mean IOP in each 2-hour segment, the ends of the box show the central 50% of the measurements, and the whiskers indicate the 95% limits of the measurements in that time window; (○) outliers.

