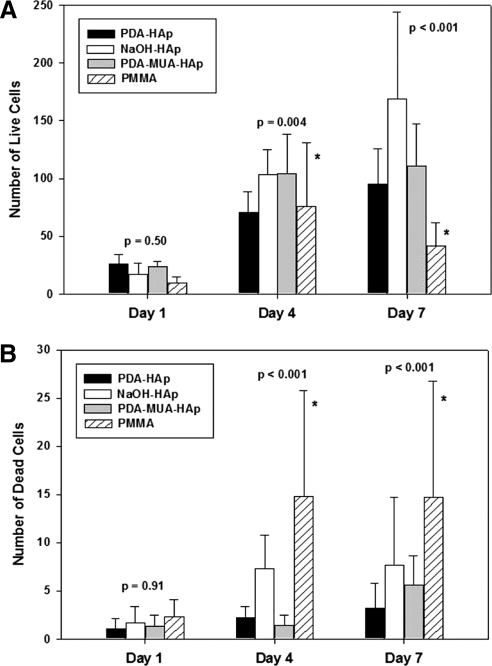
Figure 5.
Cytotoxicity PMMA discs and their hydroxyapatite coatings. Live (A) and dead (B) dead cell counts. Data are means ± SD. n = 3 in each group. Note the difference in y-axis scales. (A, asterisks) Significantly less cell viability in unmodified PMMA than NaOH and PDA-MUA treatments on day 4 and significantly less live cell counts in PMMA compared with all HAp-treated discs on day 7. (B, asterisks) Higher dead cell counts on PMMA coatings compared with all HAp-treated coatings on days 4 and 7. P-values are provided in the text.

