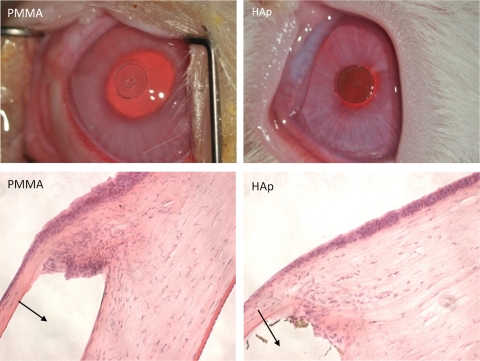
Figure 7.
Top: representative photographs of discs on postoperative day 7. Scale bar, 3 mm. Bottom: photomicrographs of hematoxylin- eosin–stained histologic sections 1 month after implantation. Arrows: location of the implant in the histologic samples. Scale bars, 200 μm. The HAp-coated discs were from the polydopamine + 11-MUA group.

