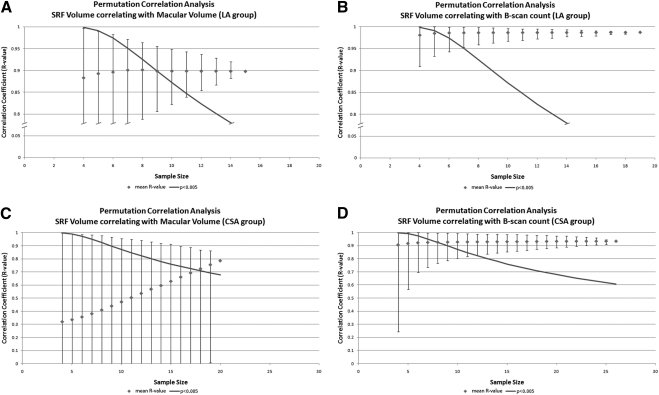
Figure 4.
Plots show the correlation coefficients (R values) obtained by permutation correlation analysis, with the error bars indicating a range of 2SDs around the mean on either side. The continuous line represents the minimum Pearson correlation coefficient, with a statistical significance of P ≤ 0.005 for two-tailed tests. Graph (A) shows the results when correlating automated macular volume and gold-standard volumetric grading of SRF in the LA group. Graph (B) is equivalent but compares the simplified parameter maximum height with the gold-standard volume. In both graphs (A and B) the y-axis is broken, as indicated for better readability. Graphs (C and D) compare the same parameters in the CSA group, respectively.

