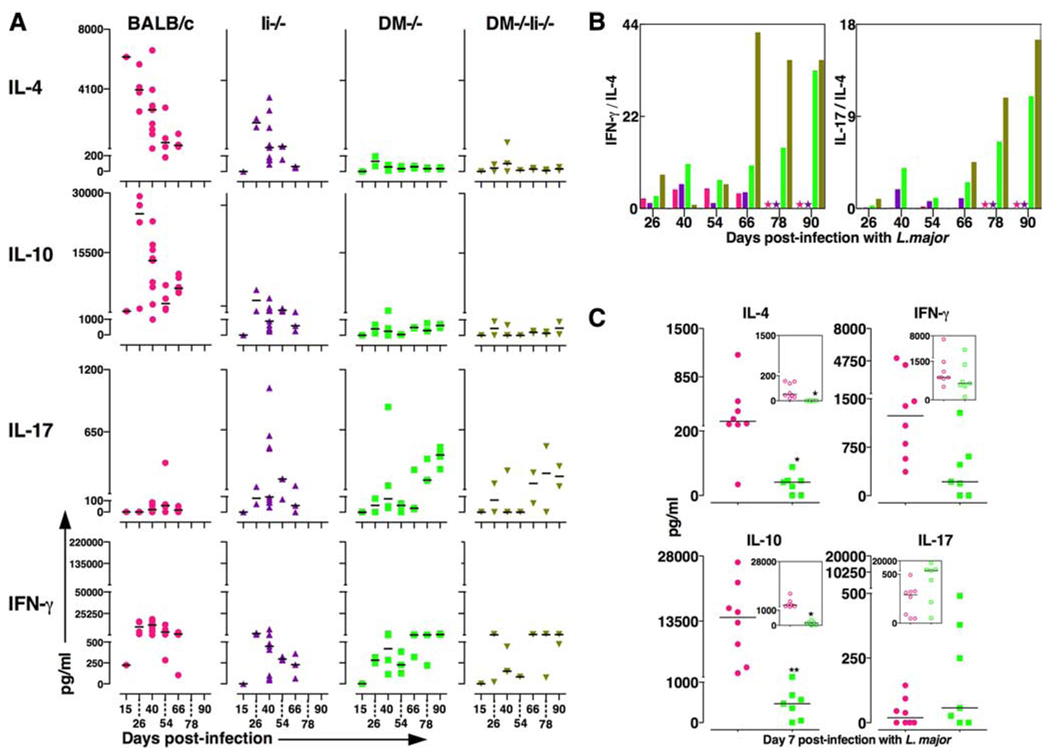
FIGURE 6.
A, DM−/− and DM−/−Ii−/− mice do not produce IL-4 and IL-10 in response to L. major infections. The supernatants derived from LN cells (shown) and spleen (not shown) cultured in vitro with SLA for 7 days were analyzed for a panel of cytokines using ELISA technique as described in Ref. 11. Time kinetics of cytokines expressed in supernatants from LN cells cultured for 24, 48, 72, 96, and 168 h are shown in supplemental Fig. 4. The data in supplemental Fig. 4 validate our choice of a 7-day period of in vitro culture. The data from individual mice from three to nine mice per strain per time point are shown. The horizontal lines represent median values of each group. The pattern of cytokine secretion from spleen cells (not shown) was similar to that from lymph node cells. Wild-type (●), DM−/− (■), Ii−/− (▲), and DM−/−Ii−/− (▼). B, DM−/− and DM−/−Ii−/− mice have significantly higher ratios of IFN-γ vs IL-4 and IL-17 vs IL-4. Data from A are shown as ratio of average value of IFN-γ vs IL-4 (left panel) and of IL-17 vs IL-4 (right panel) at a given time point postinfection to indicate that the resistance phenotype of BALB/c DM−/− and DM−/−Ii−/− mice is correlated with markedly higher ratios of inflammatory cytokines IFN-γ (left panel) and IL-17 (right panel). Color of bars are as in A. C, DM−/− mice do not make IL-4 and IL-10 even 7 days postinfection. The supernatants derived from LN cells derived from mice infected 7 days prior were cultured in vitro with SLA and were analyzed for a panel of cytokines as described in A. Data from seven to nine mice are shown as in A. GraphPad Prism 5 for MAC OS X was used for unpaired t test analysis in C. *, p < 0.05; **, p < 0.005. Symbol colors are as in A. Open symbols indicate no Ag (insets); closed symbols, with SLA.

