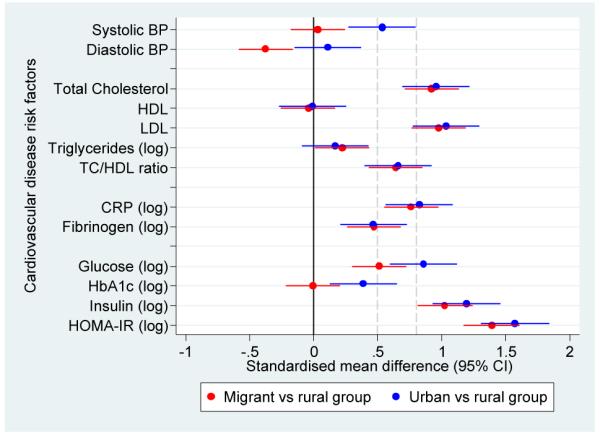
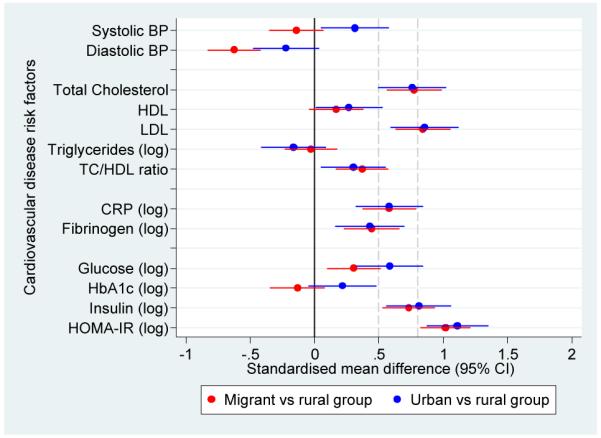
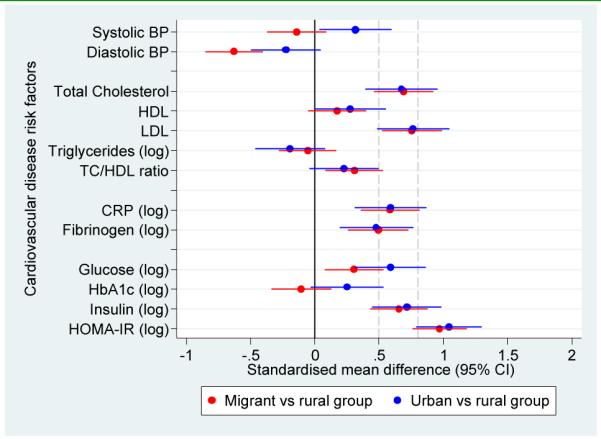
Figure 3.


Adjusted standardised mean differences in cardiovascular disease risk factors in migrant and urban population compared to rural population.
a. Standardised mean differences adjusted for age, sex, socioeconomic position and parental education
b. Standardised mean differences adjusted for age, sex, socioeconomic position, parental education and body mass index
c. Standardised mean differences adjusted for age, sex, socioeconomic position, parental education, body mass index and levels of physical activity
Notes: The solid line at zero indicate no difference compared to rural group. Additional dashed lines at 0.5 and 0.8 correspond to thresholds for moderate and large differences, respectively.
