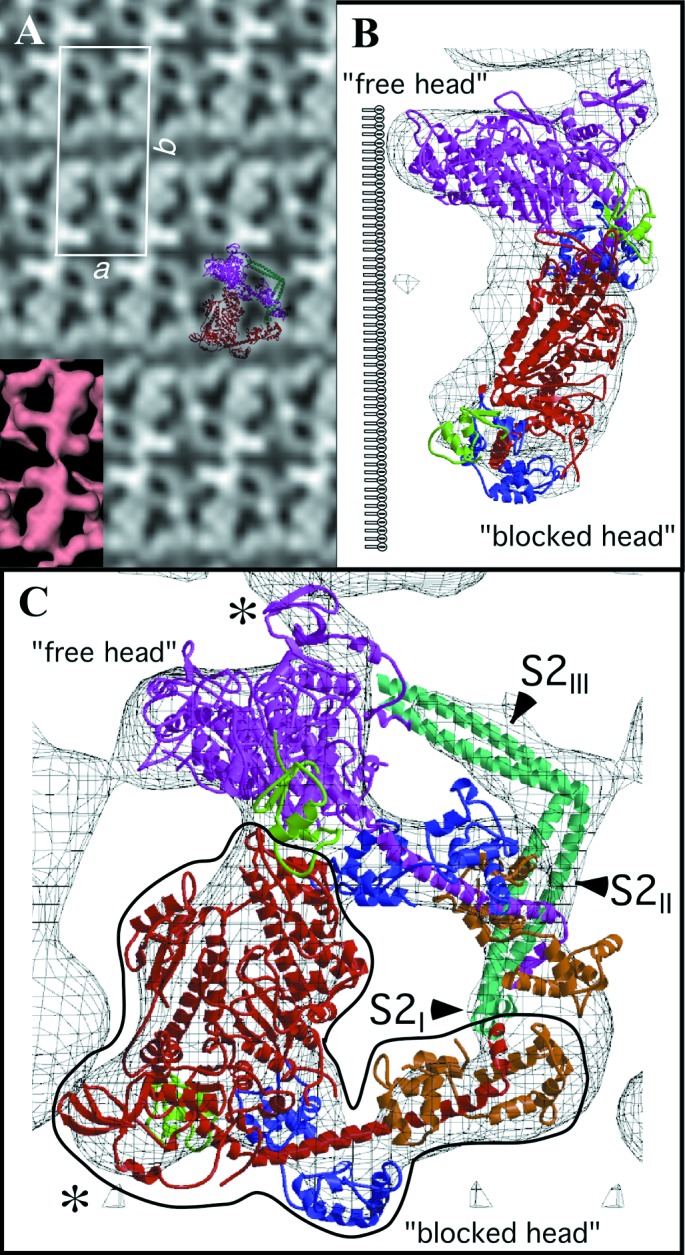
Figure 1.

Two-dimensional arrays of unphosphorylated smooth muscle HMM. (A) Averaged in-plane projection of frozen hydrated arrays with a surface view of the 3D reconstruction as Inset (Lower Left). Overlaid on the projection is a view of the 3D model reduced to the same scale. The two S1s are colored red and magenta and the S2 cyan. (B and C) Two views of the model fitted to the reconstruction. B is oriented along the crystal a axis. The location of the lipid monolayer, which is not seen in the reconstruction, is drawn to the left of the structure. C is oriented perpendicular to the plane of the crystal. The lipid monolayer would be located below the structure in this view. The “blocked” head is outlined in black. The color scheme for all ribbon diagrams is as follows: the heavy chain of the “free” myosin head is magenta, and that of the “blocked” head is red. For both myosin heads, the converter domain is green, the ELCs blue, and the RLCs orange. Figures were prepared by using bobscript and raster3d (41, 42). The region displayed in C can be seen in stereo in Fig. 5 as well as Movie 1, which are published as supplemental data on the PNAS web site, www.pnas.org.
