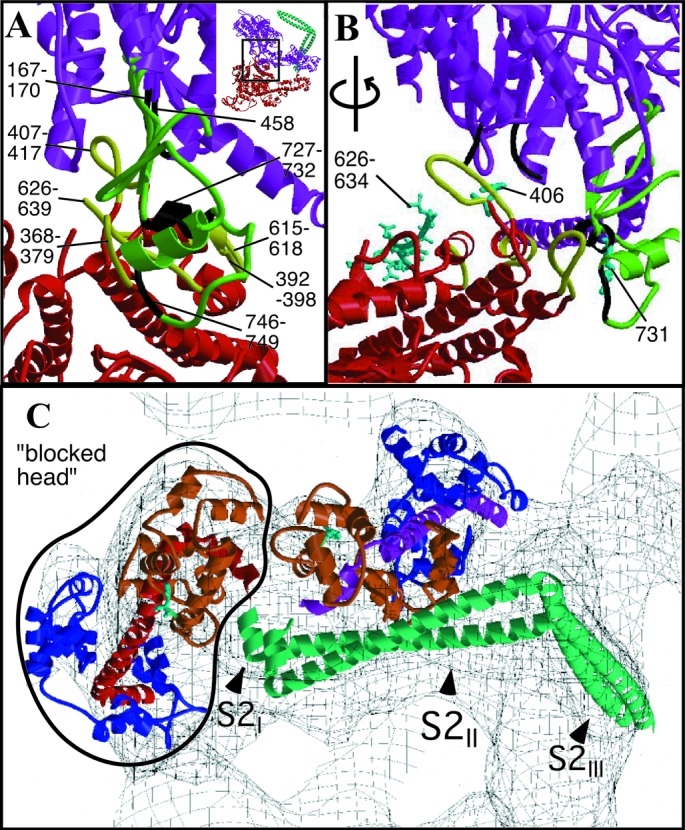
Figure 2.

(A and B) Heavy chain–heavy chain interactions. Color scheme as in Fig. 1, except that loops involved in heavy chain–heavy chain interactions are in black on the “free” head and in yellow on the “blocked” head. (A) View perpendicular to the crystal plane (upper right-hand corner Inset shows corresponding overall view). “Free” head residues potentially involved in the interaction include 458 (at the end of a disordered loop), loop 167–170, and converter domain loop 746–749 and helix 727–732. “Blocked” head residues include loop 368–379, the myopathy loop 407–417, loop 615–618, and helix 392–398. (B) Same region rotated by ≈70° to view within the crystal plane. Displayed in cyan in ball-and-stick format are residues 626–634 of the smooth muscle inhibitory domain (43) and “blocked” head residue 406 and “free” head residue 731. (C) S1–S2 junction viewed down the a axis of the unit cell. The light chain lever arm of the “blocked” head is outlined in black. The N termini of the RLCs (F19, smooth muscle F25) are shown in cyan as ball-and-stick structures. Figs. 6–8 are stereoviews of Fig. 2 A–C; the region shown in Fig. 2 A and B is Movie 2; Fig 2C is Movie 3. Figs. 6–8 and Movies 2 and 3 are published as supplemental data on the PNAS web site, www.pnas.org.
