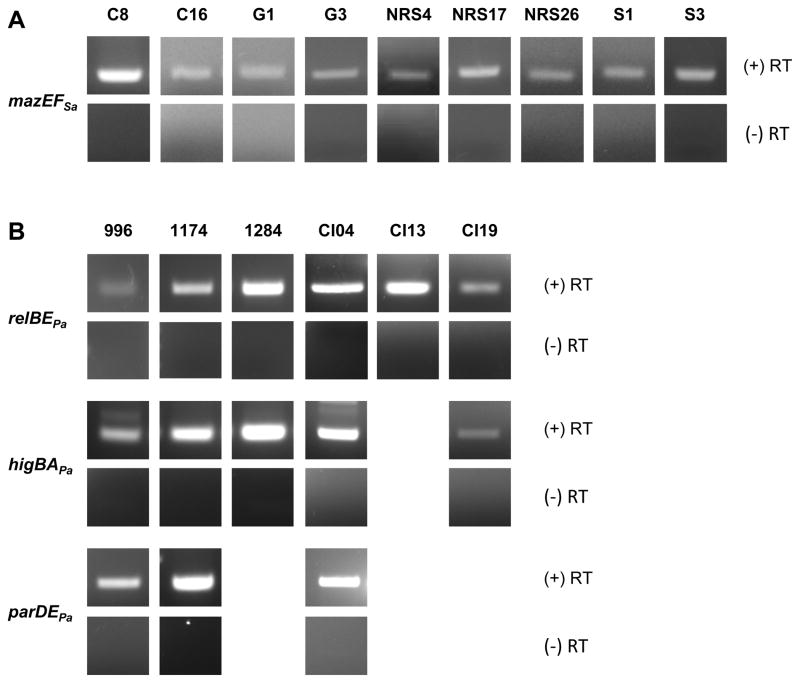
Figure 3. RT-PCR analysis of MRSA and P. aeruginosa clinical isolates.
RT-PCR with primers complementary to the genes encoding each TA system indicates that transcripts are produced in the clinical isolates of (A) MRSA and (B) P. aeruginosa, as shown in the (+) RT row. Controls for DNA contamination, in which the reverse transcriptase is omitted from the reaction mix, yield no product, as shown in the (−) RT row. Clinical isolates analyzed are indicated by the strain number above each column.

