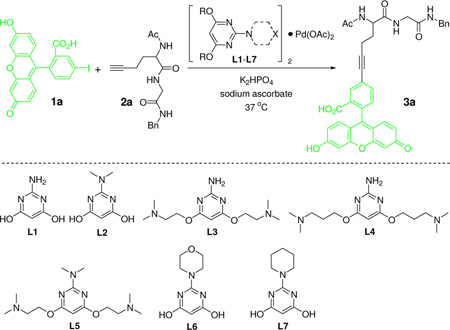
Table 1.
Ligand Screen and Reaction Condition Optimization a
 | |||||
|---|---|---|---|---|---|
| Entry | 1a : 2a | Pd • ligand | Ligand | Time | Yield (%) b |
| 1 | 1.05:1.00 | 20% | L1 | 30 min | NR |
| 2 | 1.05:1.00 | 20% | L2 | 30 min | 59 |
| 3 | 1.05:1.00 | 20% | L3 | 30 min | <5 |
| 4 | 1.05:1.00 | 20% | L4 | 30 min | <5 |
| 5 | 1.05:1.00 | 20% | L5 | 30 min | 29 |
| 6 | 1.05:1.00 | 20% | L6 | 30 min | <5 |
| 7 | 1.05:1.00 | 20% | L7 | 30 min | 13 |
| 8 | 1.00:2.40 | 30% | L2 | 40 min | 91 |
Reactions were carried out under ambient conditions without the need of insert gas protection.
Yields were derived by comparing the integration area of 3a in their respective HPLC traces to that of a standard curve. See Supporting Information for details.
